G uidelines
All information on the CheckYourFood.com platform is provided within the framework of the 'NHS England Information Standard'.
Select this link to view the NHS England Information Standard Principles as applied to checkyourfood.com.
Our Food Professional Platform is fully EU regulation (EC 1924-2006 & EC 1169-2011) compliant for food producers. Food producers can use the ingredient and recipe analysis tools to check if their products qualify for 'excellent source of' claims, along with the respective health claims that can be made for vitamin and mineral content.

CheckYourFood.com (CYF) stays abreast of all the latest peer reviewed nutritional science, food analysis & daily intake recommendations and update our platform accordingly.
The CYF science department is behind all the science publication paywalls and only references the findings of full studies.
CYF only utilise the most credible, latest and emerging science with a preference for evidence based on human studies and using Cochrane methodology.
All health benefit information derived from ‘in vitro’ and ‘in vivo’ evidence is suitably caveated.
All information is fully referenced with links to the abstract or publication given.
Evidence based on the effects of severe deficiency syndromes is not treated as strong evidence for general health benefits and is caveated using the words like ‘suggests’ and ‘may’.
CYFG check the validity of the EFSA health claims and highlights the ones we consider to be best supported by the best current available evidence.
Checkyourfood.com provide the amounts of various nutrients available in foods, this information is obtained from the UK Institute of Food research (IFR), now known as the Quadram Institute & the U.S Department of Agriculture (USDA) and other world food composition datasets. Phytochemical and essential amino acid data is sourced from the USDA .
We also provide dietary recommended intake information (RDAs) for nutrients; this information is reprinted with permission from the National Academy of Sciences, courtesy of the National Academies Press, Washington, D.C. And the Dietary Reference Values produced by the European Food Safety Authority are also incorporated.
R ules we have applied
1. We use the nutrient composition data for natural, pre-prepared and processed ingredients.
2. In general we do not use the data for fortified foods, as from the information we have, we are unclear about the benefits/dangers of adding synthetic vitamins and 'free' minerals in high amounts to food. These fortifications are separate from the natural food matrix and lack the synergy and buffering gained from the natural balance of vitamins, minerals and macronutrients in food.
3. We have included white and brown bread and flour with a link to the bread and flour regulations in relation to flour fortification. We have also included some other fortified ingredients to provide the 'added sugar' information, this is highlighted on the ingredient page.
3. We have used the US National Cancer Institute definitions for 'added' sugars.

4. We have used the latest food composition data from both the McCance and Widdowson's The Composition of Foods 7th edition (2014 CoFIDs), provided by the Quadram Institute (formerly known as the UK Institute of Food Research), and the USDA (US Department of Agriculture) food composition data tables SR28 along with other food composition tables for specific ingredients not included in the UK or US data. We will be updating our composition data with any subsequent releases of the McCance and Widdowson's The Composition of Foods and any updates to the USDA composition data.
5. We have used the USDA's data for choline, phytochemicals and essential amino acids and the UK's data for iodine and biotin in all our ingredient analysis.
6. We have used the USDA calculation for Vitamin A equivalents (alpha and beta carotene and beta cryptoxanthin that we convert to vitamin A) of: beta carotene divided by 12 and alpha carotene and beta cryptoxanthin by 24 (as opposed to beta carotene being divided by 6 and the other carotenes divided by 12). We also use the USDA conversion from International Units (IU) to micrograms (mcg) of dividing the IU by 20 to arrive at the mcg amount.
This is also to reflect more accurately the bio availability of retinol activity equivalents (RAE's).
7. We have only included specific data for the omega fatty acids, that is where the data has specifically isolated omega 3 ALA/EPA/DHA and omega 6 (N6) linoleic. Whilst there is data for undifferentiated omega 3 and 6, the health benefit research we have used is focused on the differentiated forms of the omegas.
8. For vitamin K2 MK7/9 composition data in cheeses we have used the findings of the 'Quantitative measurement of vitamin K2 (menaquinones) in various fermented dairy products using a reliable high-performance liquid chromatography method' - J. Dairy Sci. 96 :1335–1346
http://dx.doi.org/ 10.3168/jds.2012-5494 and the 'Quantitative Measurement of Tetrahydromenaquinone-9 in Cheese Fermented by Propionibacteria' - J. Dairy Sci. 90:4078–4083
doi:10.3168/jds.2006-892
9. All the composition data is for the edible portion of the food unless the ingredient states for some meat ingredients as ‘bone in’. If a meat is generally always sold with bone in, such as shoulder of lamb we have left its display name as ‘lamb shoulder’ and included data for ‘lamb shoulder – boneless’ as well. For fish all data is for the fillet unless otherwise stated and the tinned fish that include bones have been highlighted where possible.
10. Where we only have nutrient data for boneless meat, for example - niacin (B3) in the edible portion of a chicken drumstick, we have multiplied the niacin (B3) figure by the percentage of meat on an average chicken drumstick (0.65) and used this for a figure for our chicken drumstick with bone in.
11. We have included the allergen information on the 14 allergens for filtering, provided by the UK Food Standards Agency (several ingredients are now required to be referenced as allergens on all food labeling). We have also included a lactose notification as the FSA require this to be highlighted on labeling.
12. We have calculated the glycemic load figures using the standard calculation of multiplying the amount of 'available' carbohydrate (net carbs) in an ingredient by the Glycemic index figure for that ingredient and divided by 100. The Glycemic index figures have come from a comparison of figures from the Montignac method, www.glycemicindex.com, the EU Diogenes project and the American Diabetes Association. We have taken into consideration the increase in GL that occurs with the over night soaking and boiling of dried pulses and the reduction in GL when cooking pasta al dente. We have also taken into consideration the increase in GL that comes from baking sweet potato as the nature of the starch is changed.
Due to the complexity of the GI calculations these figures are a guideline only.
13. For weight change calculations we have used the Cofids appendices guidelines for grains, pasta, pulses, breads, meats and fish. In addition to these guides we have used the weight change data provided by the Food and Agriculture Organisation of the UN and the USDA.
For more detail on the CheckYourFood Group’s ‘clear and accurate’ approach to food composition data please email matt@checkyourfood.com
NB: From our research we note that changes in ingredient composition data between publications are largely within a range of 10 to 20%, which when applied to the RDA's often results in marginal differences. Some ingredients are almost identical in their composition between the UK IFR and the USDA data.
1. We are currently using the US RDAs and EU DRVs. RDA's (recommended dietary/daily allowances) are from the DRIs (dietary reference intakes) provided by the National Academy of Sciences.
DRVs (Dietary reference values also known as RIs) have been established by the EU very recently and have been integrated into the CYFG platform.
RDAs and DRVs have generally been set above estimated average requirements (EARs) with the aim of providing levels that reduce the risk of chronic disease and abnormal development rather than just avoiding deficiency.

Sometimes only an adequate intake (AI) for a nutrient has been arrived at by both the National Academy and the EU, in the light of this we have used the highest recommended amounts from both sets of recommendations.
We are using the higher daily recommended intakes levels for vitamins and minerals from either the EFSA or the NAS. This reflects our principle of integrating the latest recommendations where they are for higher intakes,(above adequate intakes for example), of micronutrients to protect health, than previously specified by the National Academy of Sciences.
We use the term RDA/RI to give the best guideline amounts for protecting and enhancing health. Users can also adjust their RDA/RIs, if for example they want more vitamin C than the official RDA/RI they can increase this in their account settings.
We will look for further expert advice as to whether we integrate the DRVs that have been set at lower levels than the RDAs.
For our Food Producer account we have included the EU NRVs (nutrient reference values), these are for food producers and provide the qualifying amounts for nutrition and health claims to be made, significant amounts' of a nutrient must be present in 100g/100ml/portion of an ingredient or food product for claims to be made.
For the nutrition college enterprise account we have added the ability to switch between our integrated daily intake values, the UK/EFSA values and the US daily intake values, for teaching purposes.
2. For essential amino acids we have taken the RDA per KG of weight and assumed an average weight for say an adult 31year old male. See below for a table of weights used for gender and ages. For the overall protein RDA we have used the National Academies average male weight of 70kg and female weight of 57.5kg (0.8g per kg of body weight).
3. We have taken the RDA for omega 3 EPA/DHA from recommendations by the World health Organisation.
4. We have applied CYF recommended daily amounts to flavonoids, lycopene, lutein and zeaxanthin, phytosterols, isoflavones, quercetin, myricetin and resveratrol. These are based on research that is referred to on these nutrient home pages.
5. For the sunshine ingredient we have calculated the likely amount of vitamin D that 10 - 60 minutes of sunshine will give a person depending on their skin colour, between 11:00 am and 3:00 pm in spring, summer and autumn in the northern hemisphere. This is based on the recommendation by Dr Michael Holick that this will be enough to meet the RDA for a whole year of 5,475 mcg, as vitamin D is stored in the liver.
1. We have only used the raw composition data for ingredients and the nutrient retention factors for various cooking methods are then applied as ingredients will typically be weighed when raw rather than when cooked.
2. We have used the nutrient retention factors (losses of nutrients during cooking) provided by the USDA, the CoFID appendices and the Food and Agriculture Organisation (United Nations).
3. We have used the iodine cooking retention factor data provided by the Indian government.
4. Within a recipe we may have applied up to 3 ‘cooking methods’ and therefore 3 sets of retention factors to some of the ingredients. For example the loss from sautéing mince followed by simmering the mince is accounted for by applying 2 sets of retention factors. This is erring on the side of caution in that you will not get less of a nutrient than we state and you may get more.

5. We have applied a cooking retention factor to the omega 3 in fish that takes into account the heaviest likely loss during certain cooking methods.
6. We have applied the phytochemical retention factors provided by phenol-explorer.eu
7. We have imputed cooking retention factors for manganese and selenium, as these are not provided by any agency, by taking the retention figure from other minerals such as magnesium, and assumed that amount of loss for these two minerals during cooking.
8. We have generally used the ‘lean and fat’ data for meats and given retention factors for the cooking methods ‘with and without drippings’ to give people the choice.
9. For meats with a high fat content we have weighed the fat released on roasted/baked wo/drippings and calculated the fat/calorie loss when this cooking method is used.
10. Where we have a recipe that calls for a weight of an ingredient that includes a large inedible portion (such as clam shells), we have calculated the nutrient content of the recipe based on the weight of the edible portion.
11. Glycemic index and load values increase with different cooking methods when applied to certain ingredients such as sweet potatoes. The GL for sweet potato doubles on baking (as the GI increases) as much of the starch has converted to sugar, and goes up by a factor of 1.6 when fried, we have reflected this in the retention factors applied for baking/frying a sweet potato by multiplying the available carbohydrate by the higher GI. We have applied the same principle to potatoes and pasta.
12. For pasta, rice and potatoes we have applied a retention factor for carbohydrate & the associated calories as starch is lost into the cooking water when boiling and draining.
1. We have classified choline as a vitamin for the purposes of displaying it on the vitamin heat map and in the science section on vitamins. Choline is not strictly considered to be a vitamin but is considered vital and is often grouped with the B vitamins.
1. For the ingredient results tab we have accounted for cooking losses, so for example when selecting ingredient results for the top 100 ingredients high in vitamin C, we have applied a cooking loss to the vitamin C in potato as potatoes are always cooked.
This result will display lower down in the top 100 than if we ordered the results by the amount of vitamin C in a raw potato.
2. For the ingredient results tab we have also applied a likely portion size to the ingredient, so for example when selecting the top 100 ingredients high in iron, without a likely portion size, dried thyme would come up first. However with a likely portion size of less than 1g, this ingredient comes much lower down the list of ingredient results.
Cockles or curry paste come much higher up the top 100 list for iron as the likely portion sizes for these ingredients are much larger than for dried thyme.

Weights in kilograms used for the RDA’s for amino acids
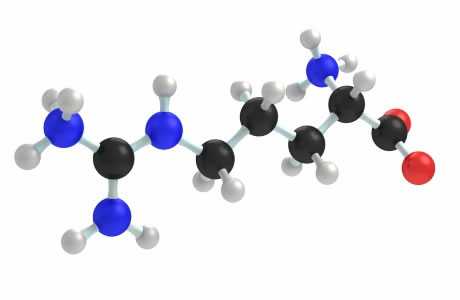
We have used average weights to fix the RDA's for amino acids as these are given in milligrams per kilogram of body weight.
If you are lighter or heavier than these averages for now you will need to adjust your RDA accordingly, for example if you are heavier than the average by 20% you need to increase your RDA by 20% in your account settings.
You may find these RDA's easy to meet however we have included the data for use by athletes, body builders, people on low protein diets, people fighting infection or depression along with information for people with PKU (phenylketonuria).
Male 0-6 months - 6kg
Female 0-6 months - 6kg
Male 6-12 months - 9kg
Female 6-12 months - 9kg
Male 1-3 years - 13kg
Female 1-3 years - 13kg
Male 4-8 years - 25kg
Female 4-8 years - 25kg
Male 9-13 years - 45kg
Female 9-13 years - 45kg
Male 14-18 years - 66kg
Female 14-18 years - 57kg
Pregnancy 14-18 years - 57kg
Lactation 14-18 years - 57kg
Male 19-30 years - 75kg
Female 19-30 years - 65kg
Pregnancy 19-30 years - 70kg
Lactation 19-30 years - 65kg
Male 31-50 years - 75kg
Female 31-50 years - 65kg
Pregnancy 31-50 years - 70kg
Lactation 31-50 years - 65kg
Male 51-70 years - 75kg
Female 51-70 years - 65kg
Male 71+ years - 75kg
Female 71+ years - 65kg
The NHS England Information Standard Principles as applied by the CheckYourFood Group
Information Production and Evidence Sources
The information on the CYF platform is subject to the following procedures and standards:
All information as it relates to health benefits must:
Originate from the peer reviewed scientific studies sourced from behind the paywalls of all the relevant scientific publications.
Or:
Originate from a reputable source such as the Harvard medical School, the UCLA Medical centre, the University of Chemical Technology of Russia or similar Universities and be fully referenced studies or articles.
All health benefit information given on CYF/CYN must be signposted and referenced.
All information that is emerging or inconclusive must be referenced using words such as ‘may prevent' or 'contribute to’.
All information as it relates to the nutrient content of food must:
Originate from a recognised food composition producing institutions such as the Quadram Institute, the USDA, and other governments such as the Australian or EU governments.
Or
Originate from peer reviewed studies obtained from the NCBI and other similar organisations.
Or
Originate from manufacturers packet data and be referenced as such.
All information as it relates to the required amounts of nutrients on a daily basis must:
Originate from recognised institutions that produce RDAs/RI’s/DRVs such as the National Academy of Sciences and the European Food Safety Authority
All information as it relates to compliance with EU regulations must:
Originate from the regulation that governs such information, such as EU Regulation EC 1924-2006 that relates to the health claims for vitamins and minerals that can be made on food products and beverages.
All information as it relates to allergens must:
Originate from the UK Food Standards Agency or International equivalent.
All information is on the CYF platform is reviewed by an authorised approver.
All information on the CYF platform is presented in plain language, is free from spelling or grammatical errors & jargon with medical terms being explained where necessary.
Each nutrient page on the CYF platform displays the last production/review date and the next review date.
User Understanding & Involvement
Our target audience has been identified along with an appropriate ‘tone of voice’ arrived at by commissioning a brand communications professional and applying their findings to all our information & communications.
All the nutritional information on the CYF platform is designed to be concise, accurate & accessible to all end users with links given to references and further reading.
All the nutritional information on the CYF platform has been reviewed by end users using recognised survey methods and the results reviewed & our information adapted accordingly.
End Product, Feedback & Review
The CYF platform is reviewed by key users on a daily basis to ensure the functionality and accuracy of the applications. Science updates, food diary entries & recipe analysis are all carried out by CYF key users.
Ongoing analysis of end user interaction with CYF is carried out with the findings being incorporated into an application update schedule, for example how far down a page a user is scrolling, bounce rates, search terms being used, most popular pages/infographics etc.
All information on the CYF platform as it relates to health benefits is fully reviewed annually.
All information as it relates to food composition (analysis) is reviewed regularly.
All information as it relates to recommended daily amounts/intakes of nutrients is reviewed annually.
All feedback via our support network is recorded, actioned and resolved as appropriate.

 About nutrients
 All nutrients
 vitamins
 minerals
 phytochemicals
 fatty acids
 macronutrients
 amino acids


